

عالمی بروکر ریگولیشن چیک کرنے والا ایپ
WikiFX
اردو
简体中文
繁體中文
English
Pусский
日本語
ภาษาไทย
Tiếng Việt
Bahasa Indonesia
Español
हिन्दी
Filippiiniläinen
Français
Deutsch
Português
Türkçe
한국어
العربية
اردو


DBG Markets: Market Report for September 11, 2026


خلاصہ:Oil Price, PPI, ECB Hike Rattle Markets, Eyes on CPI NowUS Dollar, Gold, Nasdaq 100 SP500 Index AnalysisGlobal equity benchmarks remained under intense selling pressure Thursday, September 10, 2026,

Oil Price, PPI, ECB Hike Rattle Markets, Eyes on CPI Now
US Dollar, Gold, Nasdaq 100 & S&P500 Index Analysis
Global equity benchmarks remained under intense selling pressure Thursday, September 10, 2026, as a potent combination of European monetary tightening, surging energy costs, and elevated US inflation (PPI) rattled investor sentiment.
With that, the market now turns its focus to the upcoming CPI report to further verify these inflation trends, and we may expect heightened volatility following the release.
Oil Surges, Hot PPI and ECB Hike
Yesterday, the market largely digested several key catalysts:
• Brent crude oil surged near $110 per barrel as Middle East tensions showed no signs of easing.
• This rapid surge in energy prices continues to take a toll on US inflation from the producer end, as reinforced by the latest US PPI data.
• Meanwhile, the European Central Bank (ECB) raised its key deposit facility rate by 25 basis points to 2.50%.
Focus on CPI: Whats Next?
All eyes are now firmly locked on tonight's US CPI report. If the reading comes in hotter than expected, it may further temper market sentiment as rate-hike bets sharply increase. This would continue to pressure the bond market—where the US 10-year Treasury yield has already surged to 4.96% and the 2-year yield to 4.58%—and could fuel a stronger rebound in the US Dollar.
Technical Analysis & Major Asset Outlook
USD Index: Watch for 98.80 – 99.00 Resistance
Firming Treasury yields and resurging rate-hike bets have kept a solid baseline floor near the 98.50 level and helped the dollar stage a strong rebound following the PPI print, with markets now pricing nearly a 75% probability of a September Fed hike.
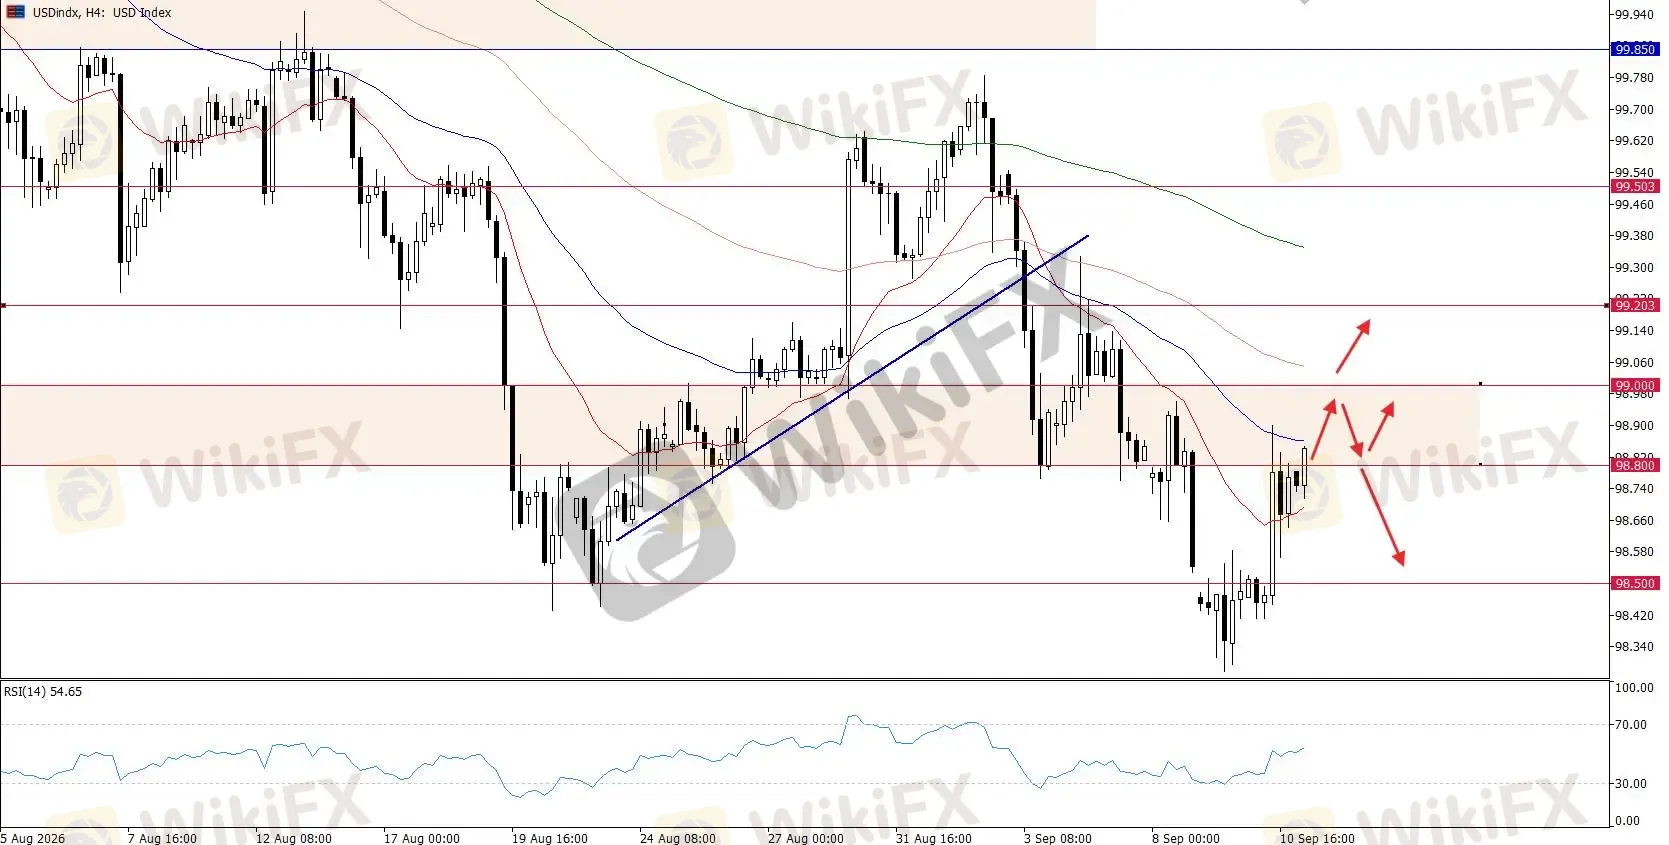
USD Index, H4 Chart
Despite the recovery, the technical posture remains heavily capped below the 99.00 overhead resistance, where traders should watch whether the current 98.80 – 99.00 area can hold as resistance or transition to support.
Spot Gold (XAU/USD): Headwinds Push Price Below $4,400
Spot gold edged lower on rising Fed hike bets and a firmer central-bank tightening outlook, breaking below the key $4,400 support level to retest near $4,320. However, gold may tell a different story depending on the short- and long-term outlook.
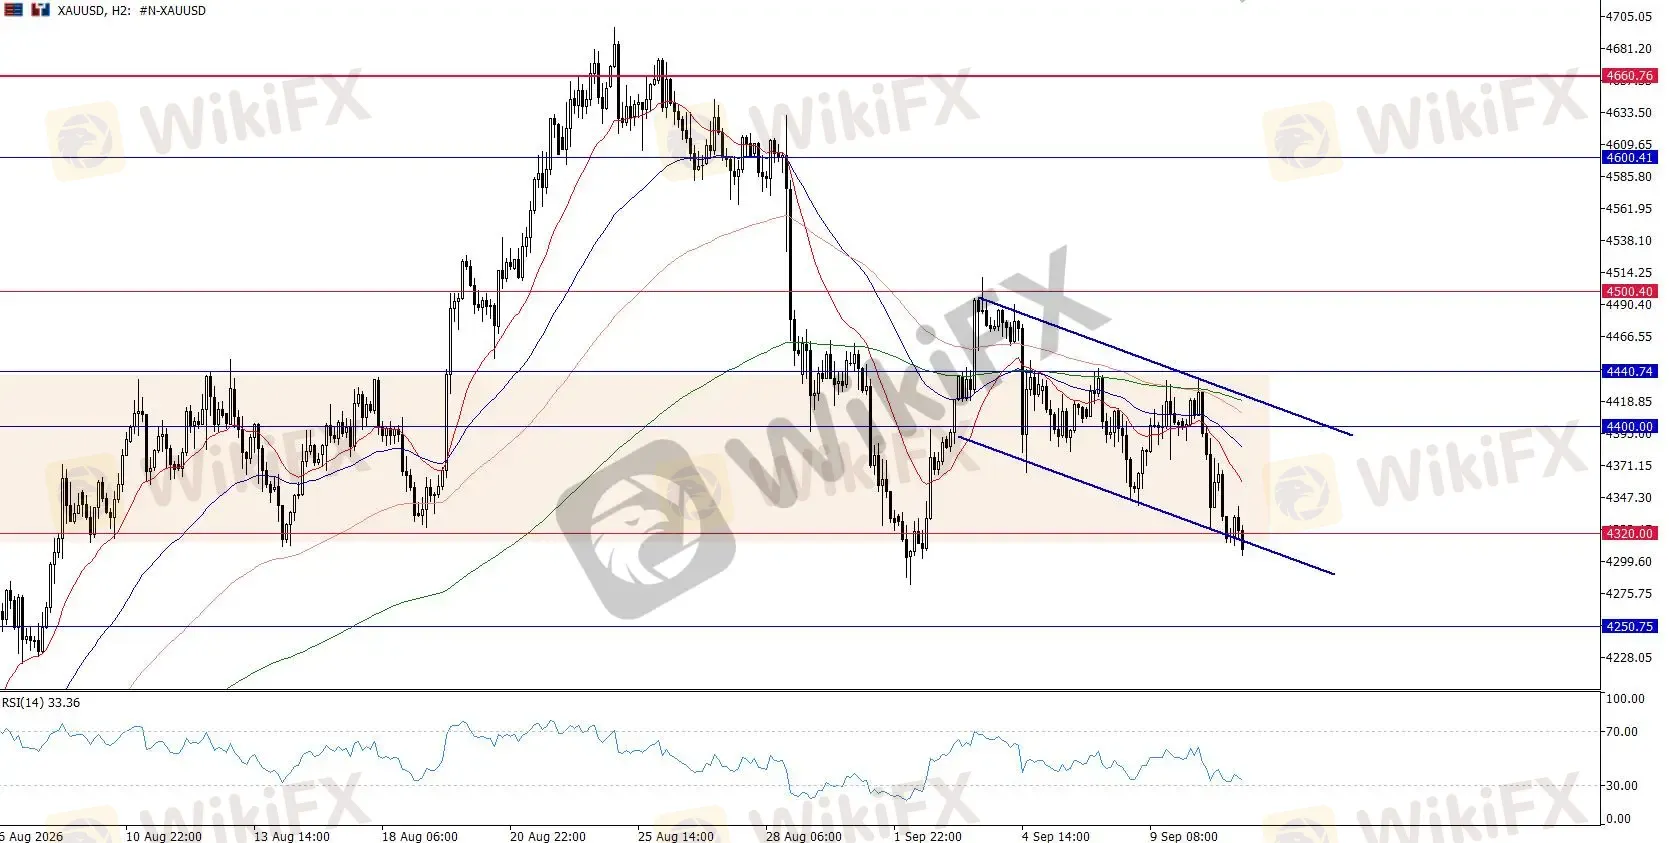
XAUUSD, H2 Chart
Gold is facing continued headwinds from rising yields and the dollar's rebound, with near-term price action showing a clear downtrend (and downtrend channel) on the 2-hour and 4-hour charts.
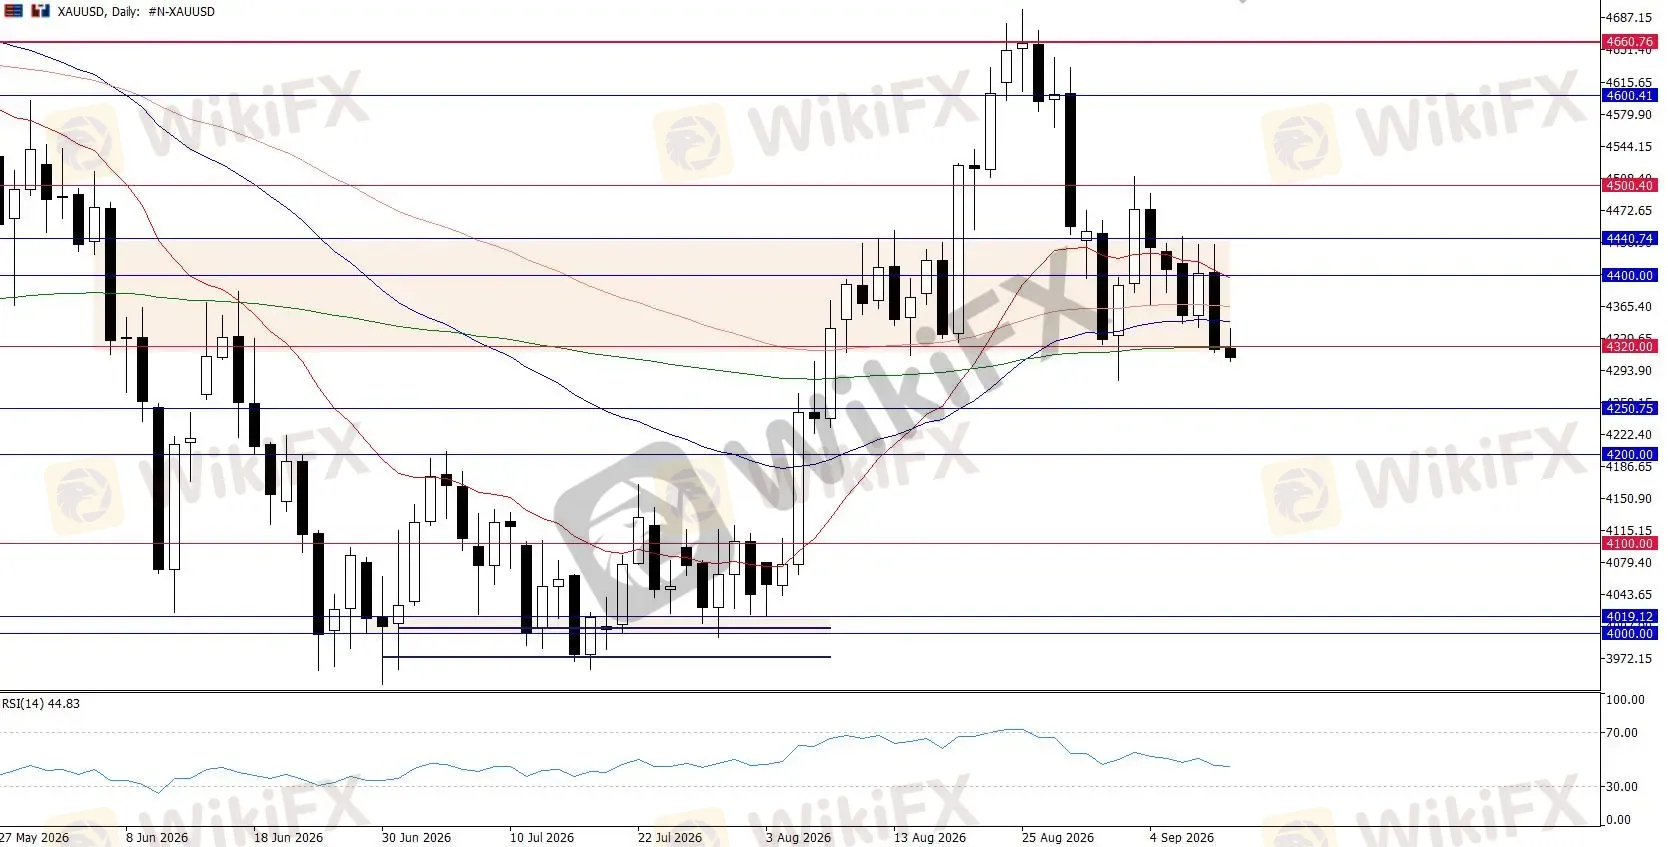
XAUUSD, Daily Chart
However, over the broader timeframe, we are seeing a technical dip or corrective phase following a previous bullish breakout.
Nasdaq 100 (UT100): Oversold Conditions vs. CPI Risk
US equities fell for a fourth consecutive session, with the tech-heavy Nasdaq down 0.65% as surging yields heavily discounted future tech earnings.
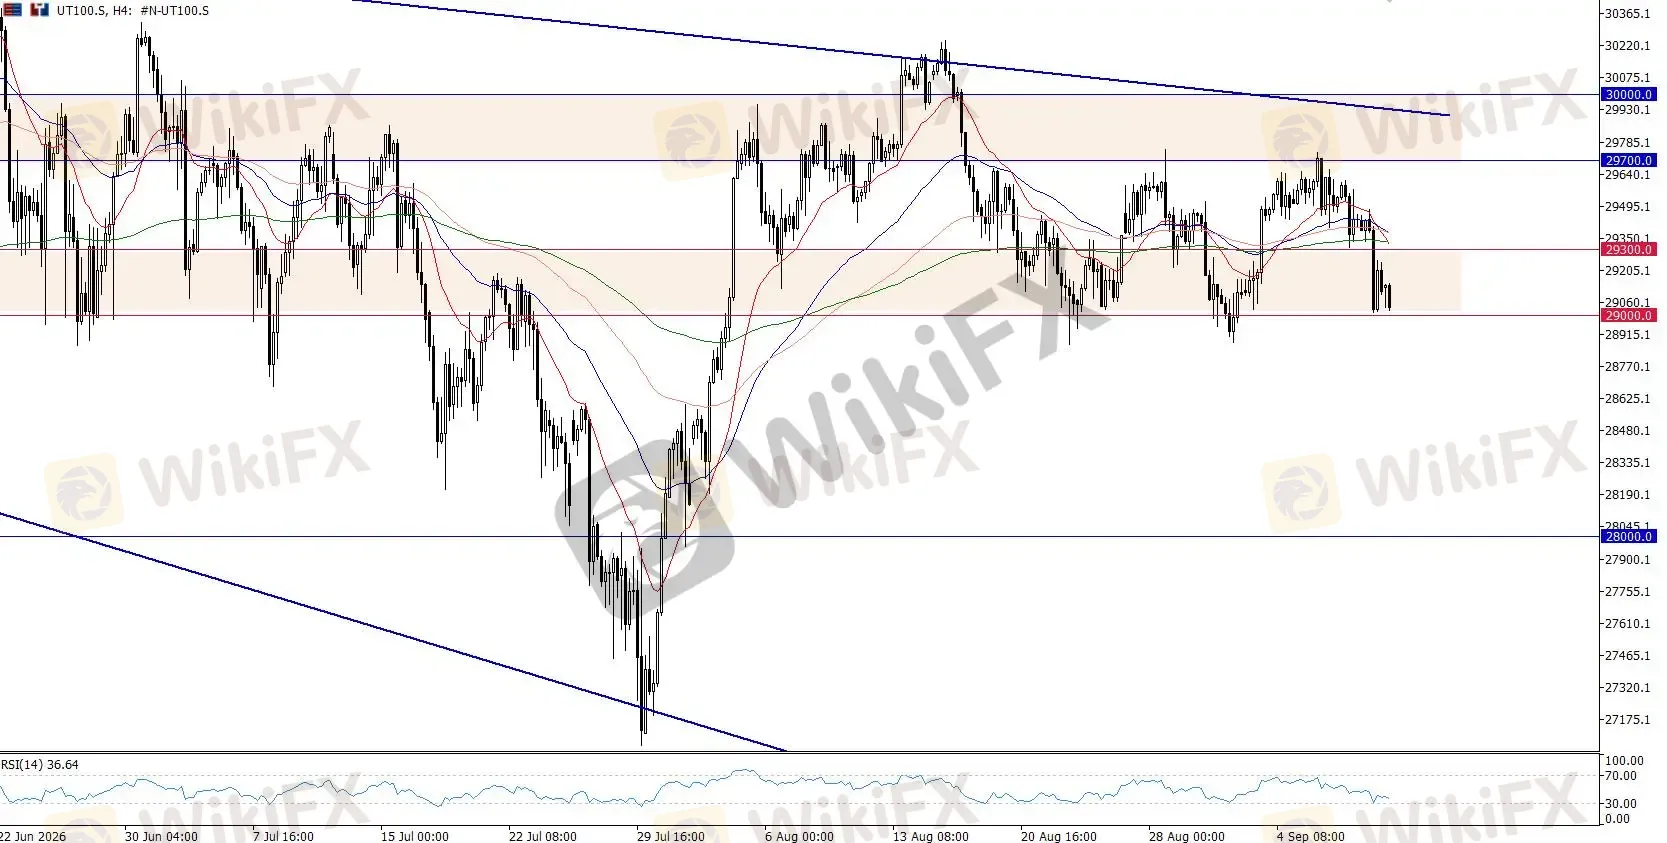
UT100, H4 Chart
Technically, the UT100 is displaying oversold conditions while keeping its consolidation move within the 29,000 – 29,700 range, which suggests a near-term bounce is possible as the index tests lower structural bounds.
S&P 500 (US500): Selling Pressure Extends
Meanwhile, the S&P 500 extended its downside amid the global equity sell-off, heavily weighed down by surging energy costs and soaring borrowing rates.
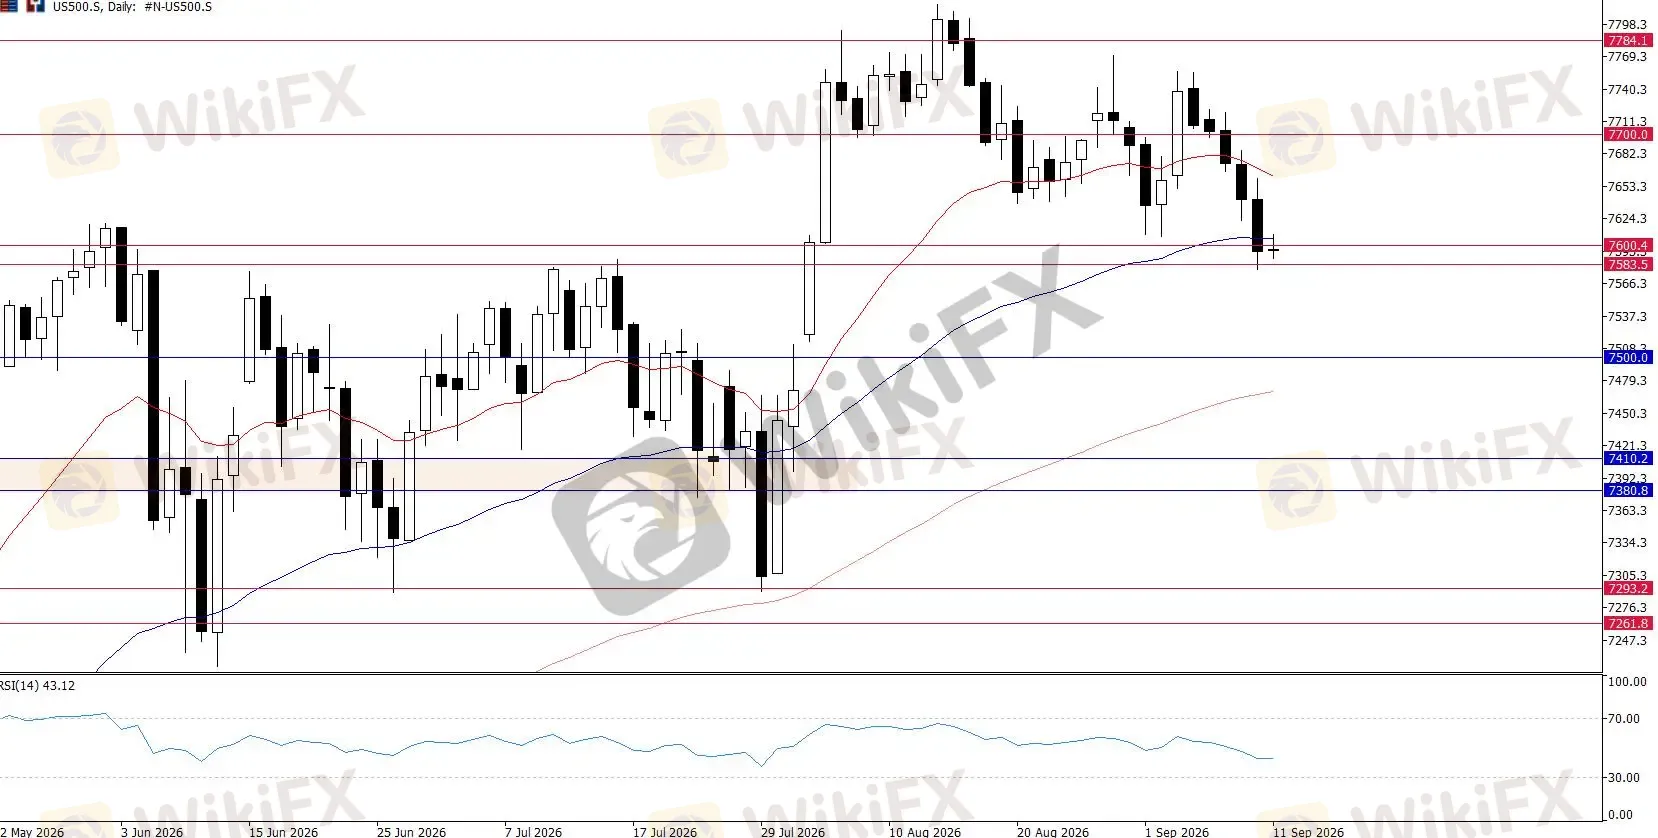
US500, H4 Chart
On the technical front, the bright side is that the 7,600 handle holds a defensive footing. However, multiple days of selling indicate that selling pressure is building up. While an oversold rebound near the 7,600 support is possible, if the CPI continues to pose a headwind, a breakdown below this level may occur.
Bottom Line & Asset Summary
Global equity benchmarks face intense selling pressure as a hawkish ECB hike, surging crude oil prices, and hot US PPI data rattle investor confidence. Markets are currently in a tense wait-and-see mode ahead of tonight's CPI report. A hot inflation print will likely cement September Fed hike bets, pushing yields higher and extending the equity sell-off while supporting the US Dollar.
• US Dollar Index: Defensive Consolidation; holding baseline floor at 98.50, capped below 98.80 – 99.00 resistance, awaiting CPI for breakout confirmation.
• Spot Gold (XAU/USD): Short-Term Bearish Pressure; broke below $4,400 with $4,320 under test, watching $4,300 – $4,250 for macro structural support.
• Nasdaq 100 (UT100): Oversold but Vulnerable; consolidating within 29,000 – 29,700, at risk of a breakdown below 29,000 on a hot CPI print.
• S&P 500 (US500): Selling Pressure Building; holding 7,600 defensive support, with CPI determining whether it rebounds or breaks lower.

ڈس کلیمر:
یہ مضمون صرف مصنف کی ذاتی رائے پر مبنی ہے، یہ پلیٹ فارم کی سرمایہ کاری کی مشورہ نہیں ہے۔ پلیٹ فارم مضمون کی معلومات کی درستگی، مکملیت اور بروقت ہونے کی کوئی ضمانت نہیں دیتا، اور مضمون کی معلومات پر اعتماد یا استعمال سے ہونے والے کسی بھی نقصان کی ذمہ داری قبول نہیں کرتا۔
WIKIFX بروکر
ہاٹ نیوز
GBP/USD میں 1.3500 کے اوپر مضبوطی، UK کی بہتر معاشی رپورٹ سے Pound کو سہارا
 WikiFX
پاکستان میں جولائی 2026 کے دوران زرعی درآمدات میں اہم تبدیلیاں
WikiFX