


UK Retail Sales July 2026 Fall 0.5%: What the Result Means for GBP
UK retail sales fell 0.5% in July 2026, while the three-month measure rose 1.1%. See the ONS details and what the mixed result may mean for GBP.
Original

简体中文
繁體中文
English
Pусский
日本語
ภาษาไทย
Tiếng Việt
Bahasa Indonesia
Español
हिन्दी
Filippiiniläinen
Français
Deutsch
Português
Türkçe
한국어
العربية
اردو




Abstract:You need a solid approach if you want to profit from trading forex. Despite the fact that numerous techniques might be effective, not all will suit every trader. This is true because everyone has varied objectives, degrees of risk tolerance, and investment budgets.

You need a solid approach if you want to profit from trading forex. Despite the fact that numerous techniques might be effective, not all will suit every trader. This is true because everyone has varied objectives, degrees of risk tolerance, and investment budgets.
Therefore, it's crucial to choose a technique that works for you specifically. Here are the top six forex trading tactics for 2022. You can use any of them with confidence because many traders have found them to be effective.
6 Techniques Professionals Recommend
The six most effective forex trading techniques for 2022 are listed below. These tactics have been tried and tested in the market of today.
Forex Fibonacci Strategy
The Fibonacci sequence is the foundation of the Fibonacci forex strategy. This method forecasts future price fluctuations by using mathematical ratios. By drawing horizontal lines at the locations where you may locate the Fibonacci retracement levels, you can use them to pinpoint regions of support and resistance.
The Fibonacci indicator may be used by forex traders to choose where to put their entry and exit orders. The idea is to set your stop-loss below the preceding swing high (downtrend) or at or above the prior swing low (uptrend) (downtrend).
Forex Bollinger Band Strategy
The market's possible levels of support and resistance can be found using a Bollinger band method. The middle line's simple moving average (SMA) is set to 20 days, while the upper and lower
When the currency market is quiet, the bands will be closer together and will expand wider when it is very turbulent. When the price hits the outside bands, the market frequently resumes its upward trend in the direction of the center 20-period moving average.
The Bollinger band technique aids in locating probable levels of support and resistance. Additionally, it aids traders in identifying when the market is getting more or less volatile as well as when prices are at their highest or lowest points.
EMA Crossover Technique
The Exponential Moving Average, or EMA, uses two EMAs with varying values to help traders determine the direction of the market. EMA crossover approaches employ the junction of two EMAs to enter the market.
All levels of traders can employ the straightforward EMA crossover methods. Additionally, it offers a reliable prediction of the trend's future course. The method is not restricted to daily or weekly charts and can be used to any time frame chart.
Forex Momentum Indicator Strategy
The most recent closing price is used in the momentum indicator forex strategy to compare it to the previous closing price. It is often shown as a single line on a different chart that is underneath the main price chart.
The indicator oscillates to and from a centreline of 100. The distance between the indicator line and 100 indicates how rapidly the price is changing.
Indicators of momentum can be used to spot overbought and oversold indications. It may be used by forex traders to assess the market's strength and gauge whether prices are growing or declining. It's crucial to check whether the market has used the momentum signal in the past and to pinpoint the elements that seem to work.
Forex Keltner Channel Strategy
When the currency pair deviates too much from the moving average, traders might use the Keltner Channel, a volatility-based trading indicator.
Two ten-day moving averages on either side of an exponential moving average are used to create the boundary bands for the Keltner Channel. Traders can assess whether a currency is oversold or overbought by comparing the price connection to each side of the channel.
Gann Trend-Follower Technique
The Gann Trend Following Strategy uses an indicator based on William Delbert Gann's angles to predict the market's next potential direction.
To determine the market's potential future direction, the Gann Trend Following Strategy makes use of a technical indicator.
The market may have started moving downward when the Gann indicator displays a yellow ribbon. On the other side, when the indicator displays a blue ribbon, an uptrend occurs. The ideal place to enter is soon after the candle closes and the ribbon changes.
Gann Trend-Follower Technique
The Gann Trend Following Strategy uses an indicator based on William Delbert Gann's angles to predict the market's next potential direction.
To determine the market's potential future direction, the Gann Trend Following Strategy makes use of a technical indicator.
The market may have started moving downward when the Gann indicator displays a yellow ribbon. On the other side, when the indicator displays a blue ribbon, an uptrend occurs. The ideal place to enter is soon after the candle closes and the ribbon changes.

Disclaimer:
The views in this article only represent the author's personal views, and do not constitute investment advice on this platform. This platform does not guarantee the accuracy, completeness and timeliness of the information in the article, and will not be liable for any loss caused by the use of or reliance on the information in the article.
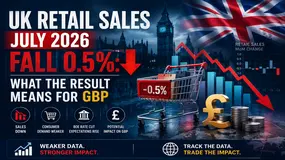
UK retail sales fell 0.5% in July 2026, while the three-month measure rose 1.1%. See the ONS details and what the mixed result may mean for GBP.

Pakistan forex reserves stood at $22.506 billion on 13 August 2026, while the SBP dashboard showed a USD/PKR mark to market rate of 277.5713 on 20 August. This article separates the SBP forex reserves facts from predictions about the Pakistan rupee and the forex market Pakistan.
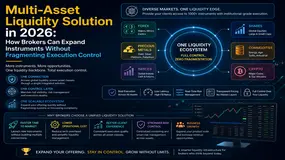
A multi-asset liquidity solution can help a broker support FX, CFDs, commodities, and indices through a more unified operating model. But adding asset classes can also create fragmented symbols, pricing, routing, margin rules, records, and client messages if controls are not designed first. This 2026 guide explains how a multi asset liquidity provider, forex CFD liquidity setup, commodity liquidity provider, and indices liquidity provider fit into a broker-owned execution service. It outlines the due-diligence questions, shared-control model, cost drivers, and 90-day implementation plan that help teams expand without making the execution chain harder to explain. The aim is not to promise deeper liquidity or better trading outcomes. It is to create evidence that a broker can supervise market access, trace order events, reconcile costs, and communicate consistently to the relevant clients when conditions are difficult.

Gold surged above $4,500 after the US Treasury expanded its purchases of longer-dated government bonds, pushing yields and the dollar lower. But this was not debt forgiveness or Federal Reserve money printing—it was a liquidity operation that exposed a much bigger fear: America may be finding it increasingly difficult to live with market-driven interest rates.
WikiFXWikiFXWikiFXWikiFXWikiFXWikiFXWikiFXWikiFXWikiFXWikiFX