


UK Retail Sales July 2026 Fall 0.5%: What the Result Means for GBP
UK retail sales fell 0.5% in July 2026, while the three-month measure rose 1.1%. See the ONS details and what the mixed result may mean for GBP.
Original

简体中文
繁體中文
English
Pусский
日本語
ภาษาไทย
Tiếng Việt
Bahasa Indonesia
Español
हिन्दी
Filippiiniläinen
Français
Deutsch
Português
Türkçe
한국어
العربية
اردو




Abstract:There are various chart patterns that traders look for in the forex market, each with their own unique characteristics and potential signals for future price movements.
There are various chart patterns that traders look for in the forex market, each with their own unique characteristics and potential signals for future price movements.
WikiFX is the best source for high-quality forex education. A forex broker search software called WikiFX enables traders to rate and review brokers. The program also includes a ton of tools and articles for teaching. Both the AppStore and Google Play store offer the WikiFX application.
One common pattern is the head and shoulders pattern, which is considered a bearish reversal signal. This pattern forms when there is a peak followed by a higher peak, and then a lower peak (the “head”), with the second peak forming the “left shoulder” and the third peak forming the “right shoulder”. The “neckline” is formed by connecting the lows of the two troughs. A break below the neckline can indicate a potential sell-off.
Another pattern is the inverse head and shoulders, which is considered a bullish reversal signal. This pattern is the opposite of the head and shoulders pattern, with a trough followed by a lower trough, and then a higher trough. The “neckline” is formed by connecting the highs of the two peaks. A break above the neckline can indicate a potential rally.
The double top and bottom pattern is another commonly observed pattern in the forex market. A double top is a bearish reversal pattern and forms when the price reaches a high twice, but is unable to break above it on the second attempt. A double bottom is a bullish reversal pattern and forms when the price reaches a low twice, but is unable to break below it on the second attempt.
The trend lines and channels are also important patterns to look for in forex trading. A trend line is a straight line that connects two or more price points and is used to identify a current trend in the market. A channel is formed by two parallel trend lines that act as support and resistance levels. A break above or below the channel can indicate a potential trend change.
It's important to note that chart patterns are just one of many tools available to traders and should not be solely relied upon for making trading decisions. They should also be confirmed by other technical indicators, as well as fundamental analysis, to increase the chances of a successful trade. Additionally, it's important to keep in mind that past performance does not guarantee future results.
In summary, chart patterns can be useful tools for identifying potential price movements in the forex market, but they should be used in conjunction with other technical and fundamental analysis to increase the chances of a successful trade.

Disclaimer:
The views in this article only represent the author's personal views, and do not constitute investment advice on this platform. This platform does not guarantee the accuracy, completeness and timeliness of the information in the article, and will not be liable for any loss caused by the use of or reliance on the information in the article.
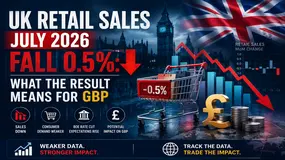
UK retail sales fell 0.5% in July 2026, while the three-month measure rose 1.1%. See the ONS details and what the mixed result may mean for GBP.

Pakistan forex reserves stood at $22.506 billion on 13 August 2026, while the SBP dashboard showed a USD/PKR mark to market rate of 277.5713 on 20 August. This article separates the SBP forex reserves facts from predictions about the Pakistan rupee and the forex market Pakistan.

A multi-asset liquidity solution can help a broker support FX, CFDs, commodities, and indices through a more unified operating model. But adding asset classes can also create fragmented symbols, pricing, routing, margin rules, records, and client messages if controls are not designed first. This 2026 guide explains how a multi asset liquidity provider, forex CFD liquidity setup, commodity liquidity provider, and indices liquidity provider fit into a broker-owned execution service. It outlines the due-diligence questions, shared-control model, cost drivers, and 90-day implementation plan that help teams expand without making the execution chain harder to explain. The aim is not to promise deeper liquidity or better trading outcomes. It is to create evidence that a broker can supervise market access, trace order events, reconcile costs, and communicate consistently to the relevant clients when conditions are difficult.

Gold surged above $4,500 after the US Treasury expanded its purchases of longer-dated government bonds, pushing yields and the dollar lower. But this was not debt forgiveness or Federal Reserve money printing—it was a liquidity operation that exposed a much bigger fear: America may be finding it increasingly difficult to live with market-driven interest rates.
WikiFXWikiFXWikiFXWikiFXWikiFXWikiFXWikiFXWikiFXWikiFXWikiFX