

Global Broker Regulation Inquiry App
About WikiFX
English
简体中文
繁體中文
English
Pусский
日本語
ภาษาไทย
Tiếng Việt
Bahasa Indonesia
Español
हिन्दी
Filippiiniläinen
Français
Deutsch
Português
Türkçe
한국어
العربية
اردو
DBG Markets: Market Report for Feb 27, 2026
Abstract:“Nvidia Rally” Fades as Macro Risks Resurface; Dollar and Oil Brace for ImpactThe AI-driven euphoria that briefly masked the broader market anxieties has quickly faded. Following the explosive Nvidia

“Nvidia Rally” Fades as Macro Risks Resurface; Dollar and Oil Brace for Impact
The AI-driven euphoria that briefly masked the broader market anxieties has quickly faded. Following the explosive Nvidia earnings rally, US equities experienced a notable pullback over the last 24 hours. The reality of lingering macroeconomic threats, specifically the unresolved universal tariff risks and sticky inflation, has swiftly returned to keep investors on edge.
This rapid shift in sentiment highlights the fragile nature of the current market structure. While tech earnings provided a temporary band-aid, the underlying fears of a renewed global trade war and a hawkish Federal Reserve continue to severely cap any sustained risk-on momentum across Wall Street.
Nasdaq Outlook: Back to Square One?
The Nasdaq 100 (UT100) is feeling the immediate weight of this returning macro anxiety. After successfully reclaiming the 25,000 psychological handles during the Nvidia surge, the index is now facing renewed selling pressure, pulling back from its localized highs.
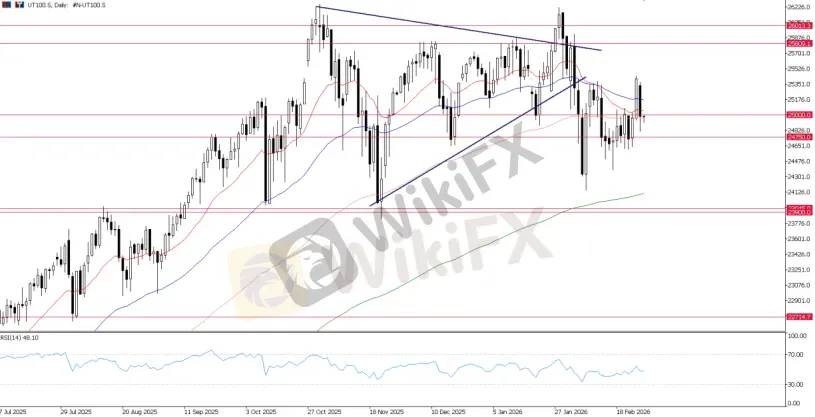
UT100, H4 Chart
For the near-term outlook, the 25,000 level remains the absolute line in the sand. If the index can defend this pivot, buyers may attempt another push toward the 25,700 resistance zone.
However, a decisive break back below 25,000 would confirm that the earnings momentum has fully evaporated, leaving the Nasdaq highly vulnerable to a deeper correction toward 24,200 as tariff fears dominate the tape.
Outlook: While a buyer-driven push higher is still possible, given the current macroeconomic landscape, the upside for the Nasdaq 100 (UT100) will likely remain capped below the 25,500 – 25,800 resistance area.
US-Iran Talk: Oil Market in Correction Risk
In the commodities complex, the energy market is facing a massive structural repricing. Although US-Iran talks were reportedly progressing well, the lack of released details kept oil traders on edge. This resulted in a massive intraday whipsaw of nearly 4% for both Brent and WTI crude, with prices ultimately closing near flat for the day.
Still, oil prices had been heavily bolstered by a “war premium” in recent weeks. If the US-Iran talks gain tangible momentum—such as an easing of sanctions or a de-escalation framework—the threat of supply disruptions would significantly diminish, effectively wiping out this “war premium”.
Consequently, the oil market is now staring down the barrel of a severe corrective slide.
USOIL Outlook
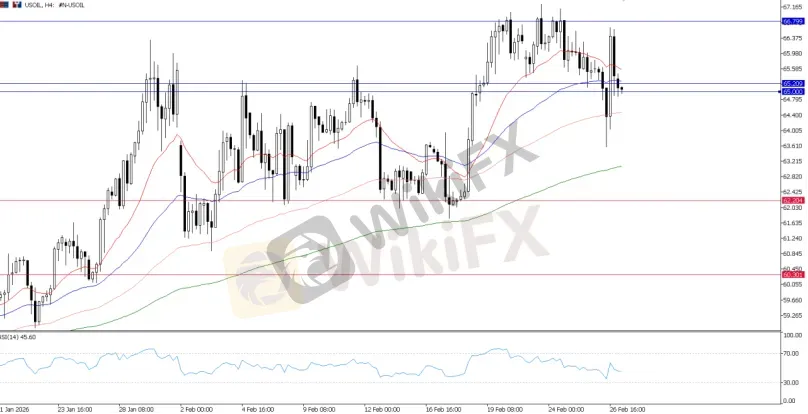
USOIL, H4 Chart
WTI Crude (USOIL) is currently suffocating under this diplomatic pressure. Prices are aggressively testing the critical 65.00 support floor.
A decisive break down below the 65.00 level would confirm a bearish reversal, or at least a sustained bearish move leading to a deeper technical pullback from the recent rally.
This could potentially open a technical void toward the 62.20 – 61.50 region as the “risk premium” officially fades.
UKOIL Outlook
Similarly, Brent Crude (UKOIL) is facing heavy overhead resistance and is dangerously hovering near the 70.00 handle.
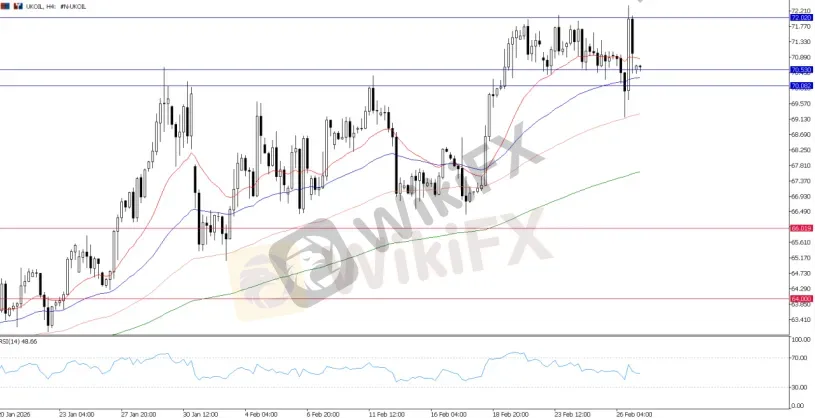
UKOIL, H4 Chart
Recent price action shows heavy overhead resistance near the 72.00 high, though the commodity still retains support above the 70.00 – 70.50 area.
The 70.00 handle now remains the key pivot determining the next move; a break below this level would likely mirror the bearish outcome anticipated for USOIL.
Crude Oil Summary: The technical structure for both benchmarks suggests that the bears are starting to take control. Unless the US-Iran talks unexpectedly collapse, any near-term upside in oil will likely be aggressively sold into.
US Dollar: Triple Top or Ascending Triangle?
The US Dollar Index is currently trading at a massive technical crossroads near the formidable 98.00 resistance zone.
The price action is compressing tightly, leaving traders debating whether this is the formation of a bearish “Triple Top” rejection or a bullish “Ascending Triangle” setup signaling an imminent breakout.
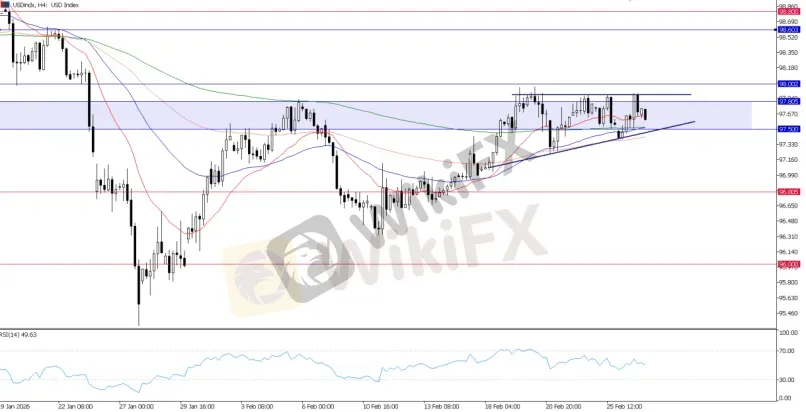
USD Index, H4 Chart
In the near term, the Dollar's trajectory remains uncertain. Traders must closely monitor for a decisive move—whether it materializes as a bullish ascending breakout or a bearish triple-top reversal.
The key levels for the Dollar Index remain the same:
· 97.50 – imminent support; 96.80 as major support
· 97.80 – imminent resistance; 98.60 as major resistance upon a bullish breakout

Disclaimer:
The views in this article only represent the author's personal views, and do not constitute investment advice on this platform. This platform does not guarantee the accuracy, completeness and timeliness of the information in the article, and will not be liable for any loss caused by the use of or reliance on the information in the article.
WikiFX Broker
Latest News
CM Trading Review 2026: Should You Trade with This Broker?
 WikiFX
Hormuz relief may not ease the economic toll that's already 'baked in,' analysts warn
WikiFXTrading the Bollinger Squeeze: How to Catch Major Trend Breakouts
WikiFXIs plexytrade Losing Customer Trust? A 2026 Review of Pending Withdrawals & Account Suspensions
WikiFXStruggling to find a job? Try looking in Nevada
WikiFXBeware of the Honey Trap: It Gets You When You Are Most Unaware
WikiFXLow Latency Trading: The Milliseconds That Can Make or Break Your Profits
WikiFXCurrency Calculator
USD

CNY
Current Rate:0
Enter amount
USD
Redeemable Amount
CNY
Calculate 