

Global Broker Regulation Inquiry App
About WikiFX
English
简体中文
繁體中文
English
Pусский
日本語
ภาษาไทย
Tiếng Việt
Bahasa Indonesia
Español
हिन्दी
Filippiiniläinen
Français
Deutsch
Português
Türkçe
한국어
العربية
اردو
DBG Markets: Market Report for July 14, 2026
Abstract:Market Braces for CPI as Energy Surges Put Inflation at Risk Dollar FX, Gold, and Nasdaq100 AnalysisGlobal financial markets are trading under intense pressure this Tuesday as dual blockades in the M

Market Braces for CPI as Energy Surges Put Inflation at Risk
Dollar & FX, Gold, and Nasdaq100 Analysis
Global financial markets are trading under intense pressure this Tuesday as dual blockades in the Middle East shake up the energy sector and light a fire under inflation fears. The market remains highly sensitive to dramatic headlines out of the Middle East and on surging energy price that put inflation at risk.
Geopolitical Trigger Inflation & Fed Expectation Shift
Following new US military strikes against Iranian targets, Iran officially announced the closure of the strategic Strait of Hormuz “until further notice.” Compounding this, the US has restarted its own blockade operations in the region.
CPI in Focus Next
With the geopolitical risk premium heavily dictating short-term price moves, the market's focus shifts directly to the high-stakes US June CPI inflation report scheduled for tonight. Headline CPI consensus stands at 3.8% (easing from 4.2% in May), while Core CPI consensus is expected at 2.9%.
Technical Outlook & Major Trading Zones
US Dollar & FX Pairs Outlook
The greenback has found strong structural support from safe-haven demand and surging bond yields, briefly piercing the 101.00 level to touch an intraday high of 101.07.
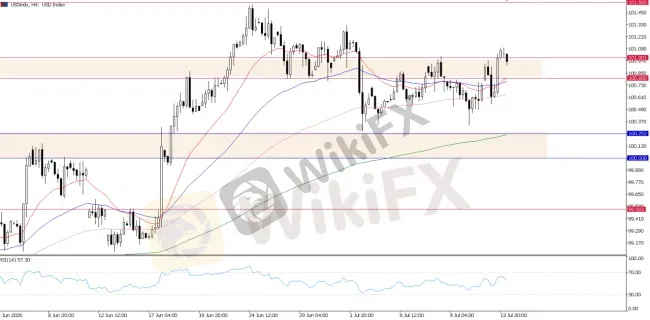
USD Index, H4 Chart
The 101.00 level remains the definitive line in the sand and a crucial technical resistance barrier. While the dollar's near-term upward momentum remains fully intact, traders should avoid over-hyping this brief pierce ahead of the CPI release.
AUD/USD: 0.6900 Defense Line Holds
Despite the broad dollar strength yesterday, the pair continues to trade defensively against a strong greenback but is showing resilience as buyers successfully maintain their hold right above the core 0.6900 – 0.6920 support zone.
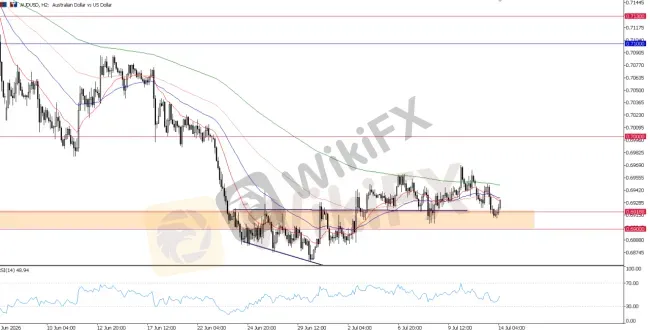
AUDUSD, H2 Chart
Our technical outlook for AUD/USD remains identical to our previous coverage. The 0.6900 – 0.6920 range continues to act as a crucial defensive line for the pair. As long as this level holds, it validates the potential short-term bullish reversal setup, as the pair currently sits at a major long-term structural support floor.
US/CAD: Gains on Commodities Strength
The Canadian Dollar is displaying independent strength, driven by the surge in crude oil prices. Yesterday's move showed the Canadian dollar actively defying broad US dollar strength.
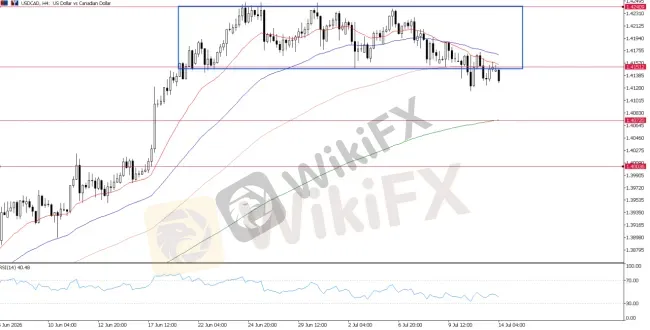
USDCAD, H4 Chart
USD/CAD has staged a clean technical breakdown below its high-side consolidation phase, clearing the 1.4150 floor. Even with broad US dollar strength yesterday, USD/CAD rebounds remained strictly capped.
If tonight's CPI numbers weaken the greenback, this pair will offer an ideal shorting opportunity. The next major downside targets lie at 1.4070 followed by the 1.4000 psychological baseline.
Gold (XAU/USD) Outlook
Despite the severe escalation in Middle East risks, spot gold has broken down through key structural floors as skyrocketing bond yields and a strong US dollar crush demand for non-yielding assets.
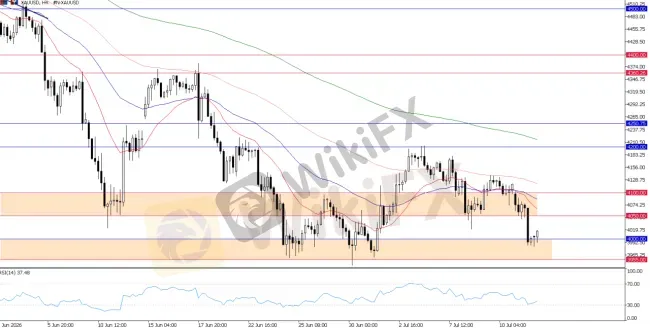
XAUUSD, H4 Chart
Gold prices have broken below the vital $4,050 level, opening the door for an aggressive test of the major $4,000 psychological baseline. For broader position and mid-term traders, caution is advised before shorting aggressively at these lows.
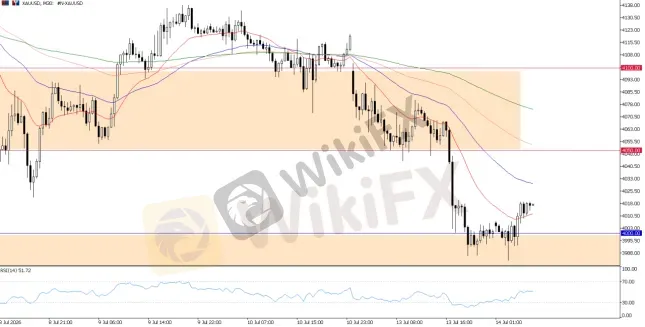
XAUUSD, H1 Chart
While we are seeing a minor short-term bounce off the $4,000 round number, the intraday bias remains firmly bearish. Traders should look for technical rebounds to stall near the $4,000 psychological level. The near-term strategy is to sell into technical rallies as long as prices trade underneath the flipped $4,050 resistance ceiling.
Nasdaq 100 Analysis: Tech Under Pressure
The tech-heavy benchmark continues to face steep technical challenges as the jump in the 2-year yield to 4.28% triggers aggressive outflows and profit-taking from high-valuation growth sectors. The technical structure leaves large-cap tech highly vulnerable to further downside risks, and any hot inflation surprise tonight could trigger an aggressive wave of selling.
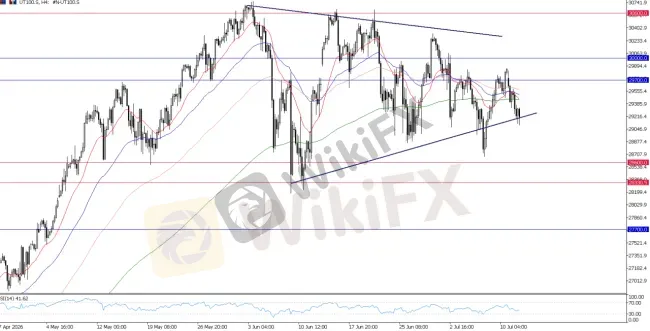
UT100, Daily Chart
Bottom Line & Asset Summary
Global financial markets are locked in a high-stakes standoff as the dual blockades in the Strait of Hormuz push oil past $80.00, reigniting Fed rate hike bets and sending the 2-year yield to a local high of 4.28%. While the US Dollar sits precariously at its 101.00 technical line in the sand, gold has collapsed to test its critical $4,000 structural floor, and tech indices remain exposed to heavy downside risks. Tonight's US CPI print—amplified by Governor Waller's explicit rate hike warnings—serves as the ultimate directional arbiter. A hot reading will cement the dollar's breakout and deepen non-dollar asset liquidation, while a cool print will offer a vital technical lifeline to gold and equities.

Disclaimer:
The views in this article only represent the author's personal views, and do not constitute investment advice on this platform. This platform does not guarantee the accuracy, completeness and timeliness of the information in the article, and will not be liable for any loss caused by the use of or reliance on the information in the article.
WikiFX Broker
Latest News
trading.com Review 2026: Regulation, MT5 Access, and Complaint Signals
 WikiFX
Behind The Screenshots: The Forex Success You See Online May Not Be Real
WikiFXThe NFP Gap Slippage: Why Your 1.1000 Stop Executed at 1.0950
WikiFXFBS Review 2026: Complaints, Withdrawals, and Risk Signals
WikiFXDollar Gains While Yen Finds Support
WikiFXDollar Advances on Middle East Conflict
WikiFXThe 3-Bullet Rule: How a Paper Card Stops Overtrading
WikiFXVALUTRADES Review 2026: Slippage Complaints, Regulation, and Safety Risks
WikiFXQuotex Review 2026: Official Warnings, Blocked Accounts, and High Risk
WikiFXAxim Trade Review: Withdrawal Alarms, Weak Regulation, and a Broker Risk Traders Cannot Ignore
WikiFX